SHINKO ELECTRIC INDUSTRIES CO., LTD.
SHINKO ELECTRIC INDUSTRIES CO., LTD.
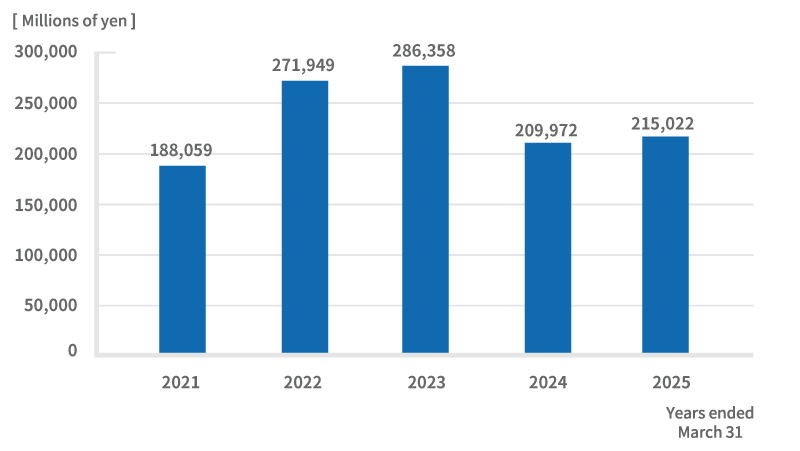
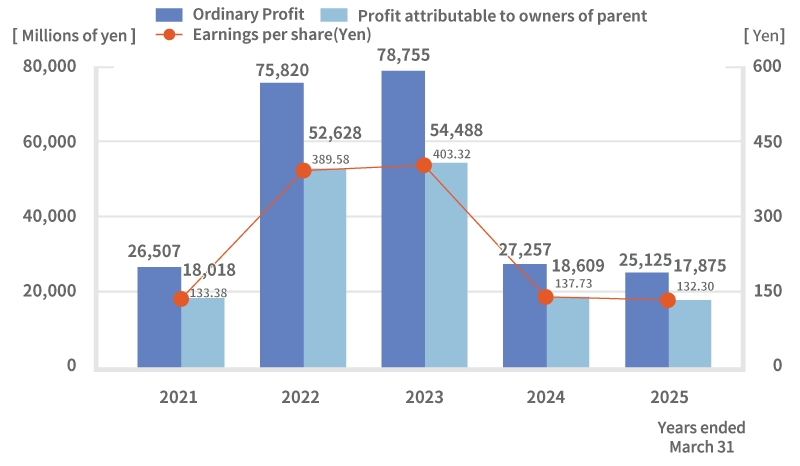
(Millions of yen)
| Years ended March 31 | 2021 | 2022 | 2023 |
2024 |
2025 |
|---|---|---|---|---|---|
| Net sales | 188,059 | 271,949 | 286,358 | 209,972 | 215,022 |
| Operating profit | 23,328 | 71,394 | 76,712 | 24,810 | 25,354 |
| Ordinary profit | 26,507 | 75,820 | 78,755 | 27,257 | 25,125 |
| Profit attributable to owners of parent | 18,018 | 52,628 | 54,488 | 18,609 | 17,875 |
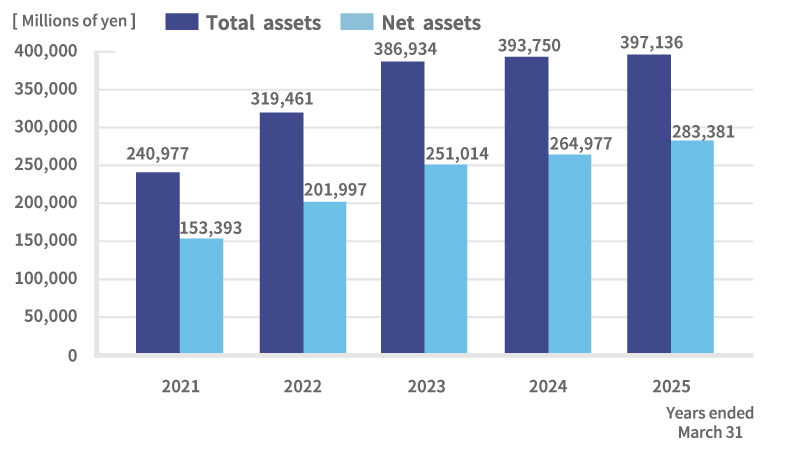
| Total assets | 240,977 | 319,461 | 386,934 | 393,750 | 397,136 |
| Net assets | 153,393 | 201,997 | 251,014 | 264,977 | 283,381 |
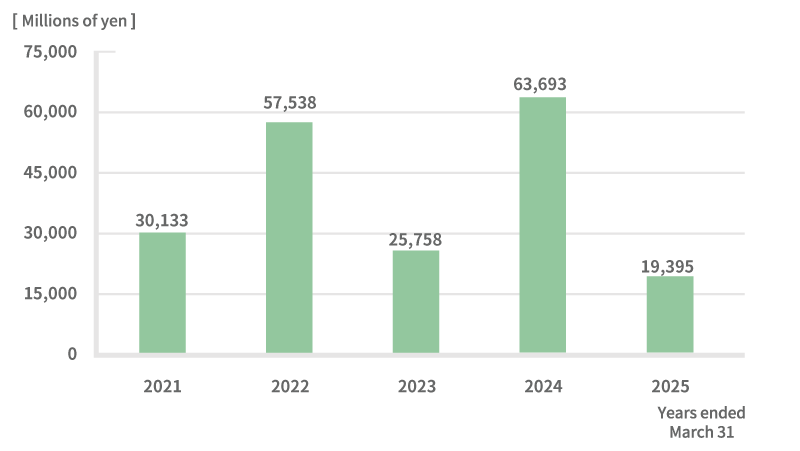
| Capital expenditure* | 30,133 | 57,538 | 25,758 | 63,693 | 19,395 |
| Depreciation* | 17,364 | 30,018 | 34,511 | 27,435 | 26,370 |
| Research & development | 2,981 | 3,478 | 3,580 | 3,496 | 4,082 |
| Equity ratio | 63.7% | 63.2% | 64.9% | 67.3% | 71.4% |
| Profit attributable to owners of parent / equity | 12.4% | 29.6% | 24.1% | 7.2% | 6.5% |
| Earnings per share (Yen) | 133.38 | 389.58 | 403.32 | 137.73 | 132.30 |
| Net assets per share (Yen) | 1,135.49 | 1,495.28 | 1,857.90 | 1,961.09 | 2,097.30 |
| Cash dividends per share (Non-consolidated) (Yen) | 30.00 | 45.00 | 50.00 | 25.00 | 0.00 |
The figures exclude intangible fixed assets.
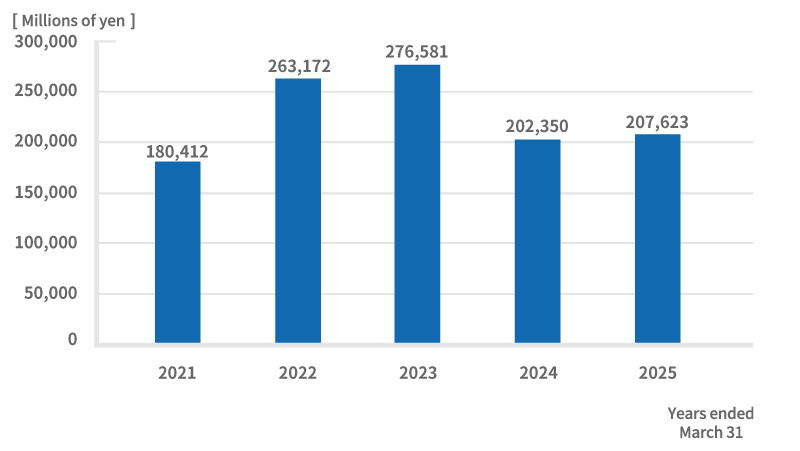
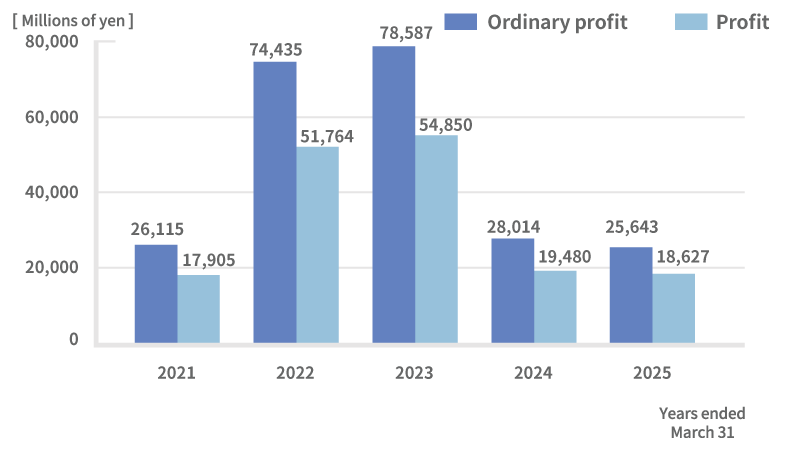
(Millions of yen)
| Years ended March 31 | 2021 | 2022 | 2023 | 2024 | 2025 |
|---|---|---|---|---|---|
| Net sales | 180,412 | 263,172 | 276,581 | 202,350 | 207,623 |
| Operating profit | 22,235 | 68,867 | 73,628 | 23,735 | 24,049 |
| Ordinary profit | 26,115 | 74,435 | 78,587 | 28,014 | 25,643 |
| Profit | 17,905 | 51,764 | 54,850 | 19,480 | 18,627 |